No one can argue that the earth has been warming and cooling for millions of years but the climate alarmists are getting lots of media about human caused climate change. Governments are jumping on new carbon taxes and other environmental taxes that bring in tens of billions annually promising to fix the problem. Climate alarmists have been screaming the oceans will rise 20ft since 1904, yet they have not. Since the 1950s they have warned that total disaster is 12 years away but somehow we are all still here.
Now nobody is saying we shouldn’t be striving constantly to do things that are good for the planet BUT government fear mongering for power and more tax dollars needs to be exposed.
Today’s world is largely based on “feelings” and not facts. The recent Covid episode clearly demonstrated this. If it feels true then is it true, regardless of facts and data. Masks “feel” like they work even though all science proved they did nothing. That did not stop the entire planet from wearing them for over two years and most likely years more.

Governments all over the world have now seen what they can do with FEAR. They are already planning the next fear campaign “THE CLIMATE EMERGENCY” that they can use to garner more power and of course money. You can read our article on 50 years of the last 50 eco-disaster fear campaigns and see none came true here.
Government “experts” are used to promote false information and the next event will be no different. People will forget that every single projection the “experts” made was wrong and not just a little bit wrong, grossly incompetently wrong.
The first question a reasonable person should ask is,
“Is there a problem?”
Luckily we have the data of thousands of years of global temperatures. This knowledge about past warm climates may help to clarify what is in store for us now that we are facing a global warming.
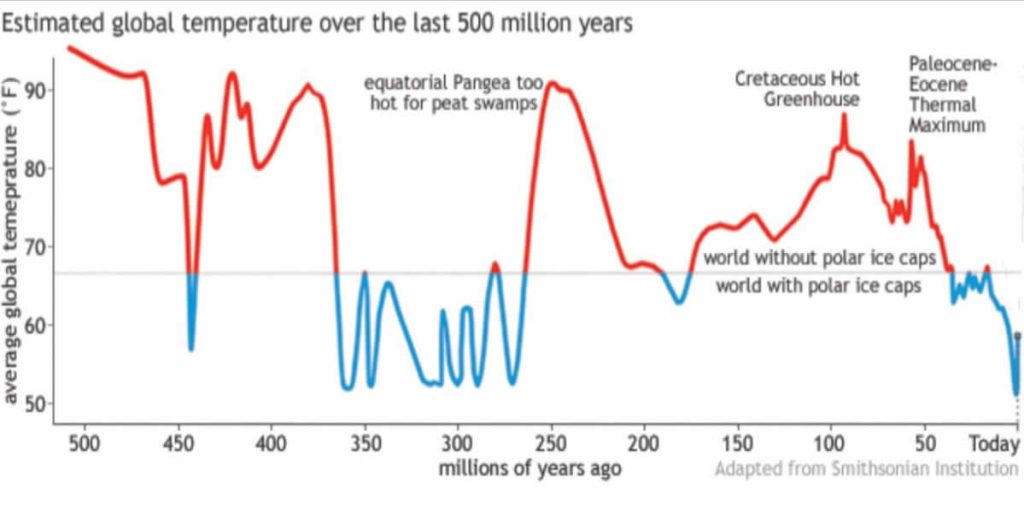
As you can see from the above chart displaying the earths temperatures for the past 500 million years, the earths temperature is constantly changing. In fact we are in some of the coolest times in history.
The North Greenland Eemian Ice Drilling project or NEEM, led by the Niels Bohr Institute, is an international project with participants from 14 countries. After four years of deep drilling, the team has drilled ice cores through the more than 2.5 kilometer thick ice sheet. The ice is a stack of layer upon layer of annual snow fall which never melts away, and as the layers gradually sink, the snow is compresses into ice. This gives thousands of annual ice layers that, like tree rings, can tell us about variations in past climate from year to year.
The researchers obtained the first complete ice core record from the entire previous interglacial period, the Eemian, and with the detailed studies have been able to recreate the annual temperatures — almost 130,000 years back in time.
The data and charts below come from NASA, a link at bottom of article is provided.
Explaining Rapid Climate Change Of The Past And Its Causes
When scientists started to analyze the paleoclimate evidence in the Greenland and Antarctic ice cores, they found that the record also supported Milankovitch’s theory of when ice ages should occur. But they also found something that required additional explanation: some climate change appeared to have occurred very rapidly. Because Milankovitch’s theory tied climate change to the slow and regular variations in Earth’s orbit, the scientific community expected that climate change would also be slow and gradual. But the ice cores showed that while it took nearly 10,000 years for the Earth to totally emerge from the last ice age and warm to today’s balmy climate, one-third to one-half of the warming—about 15 degrees Fahrenheit—occurred in about 10 years, at least in Greenland. A closer look at marine sediments confirmed this finding. Although the overall timing of the ice ages was clearly tied to variations in the Earth’s orbit, other factors must have contributed to climate change as well. Something else made temperatures change very quickly, but what?

The Earth’s Shifting Orbit
From the scratched rocks strewn haphazardly across the landscape and the thin layer of soil left behind by retreating glaciers, scientists learned that the Earth had gone through at least three or four ice ages. Noticing that the ice came and went cyclically, they began to suspect that the ice ages were connected to variations in the Earth’s orbit.
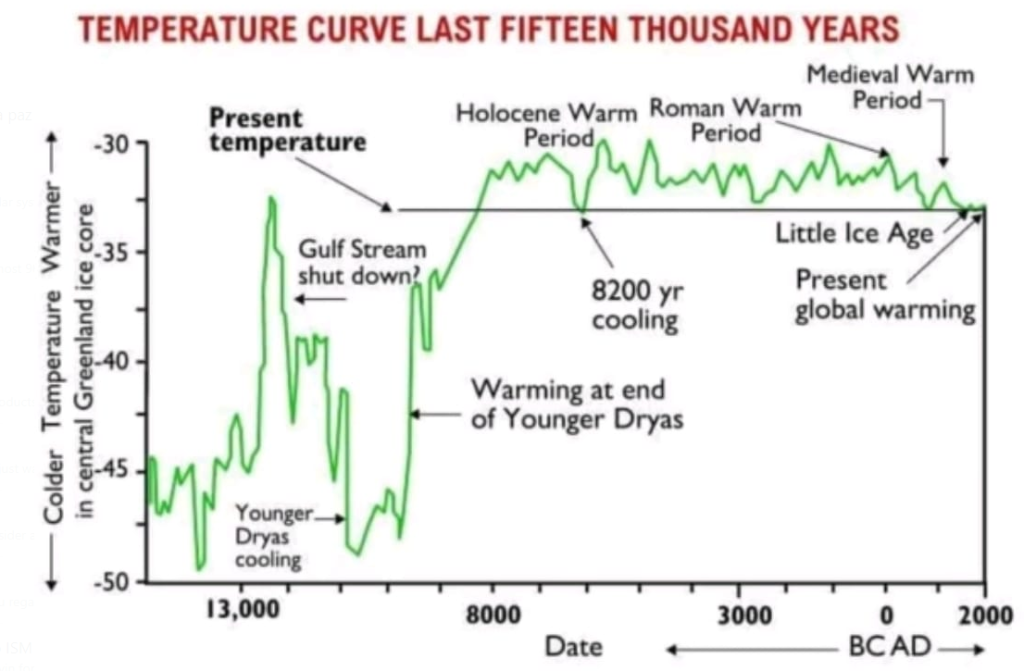
Ice cores also provide a glimpse of past temperatures and preserve tiny bubbles of ancient atmosphere.
Rapid changes between ice ages and warm periods (called interglacials) are recorded in the Greenland ice sheet. Occurring over one or two decades, the warming of the Earth at the end of the last ice age happened much faster than the rate of change of the Earth’s orbit. The last cool period (stadial), immediately before the current interglacial, began and ended suddenly, and was likely caused by changes in the deep ocean circulation. (Graph by Robert Simmon, based on data provided by Alley 2004.)
https://earthobservatory.nasa.gov/features/Paleoclimatology_Evidence/paleoclimatology_evidence_2.php
The Earth circles the Sun in a flat plane.
It is as if the spinning Earth is also rolling around the edge of a giant, flat plate, with the Sun in the center. The shape of the Earth’s orbit—the plate—changes from a nearly perfect circle to an oval shape on a 100,000-year cycle (eccentricity). Also, if you drew a line from the plate up through the Earth’s North and South Poles—Earth’s axis—the line would not rise straight up from the plate. Instead the axis is tilted, and the angle of the tilt varies between 22 and 24 degrees every 41,000 years (obliquity). Finally, the Earth wobbles on its axis as it spins. Like the handle of a toy top that wobbles toward you and away from you as the toy winds down, the “handle” of the Earth, the axis, wobbles toward and away from the Sun over the span of 19,000 to 23,000 years (precession). These small variations in Earth-Sun geometry change how much sunlight each hemisphere receives during the Earth’s year-long trek around the Sun, where in the orbit (the time of year) the seasons occur, and how extreme the seasonal changes are.
Sea-floor sediments, ice sheets, corals, cave formations, ancient trees, and alpine glaciers all hold clues to past climates. Scientists have assembled a coherent picture of the Earth’s climate history by combining data from all these and other sources. [Photographs copyright (left to right) Woods Hole Oceanographic Institute, Reto Stöckli, National Oceanic and Atmospheric Administration, National Park Service, Jessica Bray, and Robert Simmon.]
In the early 1900s, a Serbian mathematician named Milutin Milankovitch meticulously calculated the amount of sunlight each latitude received in every phase of Earth’s orbital variations. His work culminated in the 1930 publication of Mathematical Climatology and the Astronomical Theory of Climate Change. He theorized that the ice ages occurred when orbital variations caused the Northern Hemisphere around the latitude of the Hudson Bay and northern Europe to receive less sunshine in the summer. Short, cool summers failed to melt all of the winter’s snow. The snow would slowly accumulate from year to year, and its shiny, white surface would reflect more radiation back into space. Temperatures would drop even further, and eventually, an ice age would be in full swing. Based on the orbital variations, Milankovitch predicted that the ice ages would peak every 100,000 and 41,000 years, with additional “blips” every 19,000 to 23,000 years.
The Earth’s orbit varies over tens and hundreds of thousands of years. Combined changes in eccentricity, obliquity, and precession alter the strength and location of sunlight falling on the Earth’s surface. (Graphs by Robert Simmon based on data from Berger 1992.)
The paleoclimate record shows peaks at exactly those intervals. Ocean cores showed that the Earth passed through regular ice ages—not just the 3 or 4 recorded on land by misplaced boulders and glacial loess deposits—but 10 in the last million years, and around 100 in the last 2.5 million years.
(Upper graph) The rise and fall of the intensity of sunlight (insolation) in the far North during the summer—determined by the Earth’s orbit—drives ice ages. Weak summer sunlight year after year allows snow to accumulate and glaciers to advance. The reflective ice sheets further cool the Earth’s surface, resulting in global ice ages. When the Northern Hemisphere receives more sunlight, the snow melts, ice sheets retreat, and Earth warms.
(Lower graph) Oxygen isotopes trapped in ocean sediments record cycles of ice ages millions of years into Earth’s past. This climate record matches the frequency of orbital changes, although tangled feedbacks make the relationship complex. Dips represent ice ages, and spikes represent interglacials. (Graph by Robert Simmon, based on data from Berger 1992 and Lisiecki 2005.)
Greenhouse Gases
Scientists are now exploring a few possibilities. First, greenhouse gases probably influenced past climates. Ice cores record past greenhouse gas levels. In the past, when the climate warmed, the change was accompanied by an increase in greenhouse gases, particularly carbon dioxide. When scientists tried to build climate models, they could not get the models to simulate past climate change unless they also added changes in carbon dioxide levels. Though scientists aren’t sure why carbon dioxide levels changed, almost all believe that the shift contributed to altering the climate. Because ice cores also revealed that carbon dioxide levels are much higher today than at any time recorded in the past 750,000 years, pinning down the cause-and-effect relationship between carbon dioxide and climate change continues to be a focal point of modern climate research.
Global Conveyor Belt
Another possible trigger for rapid climate change is ocean circulation. Today, warm water from the equator is carried towards the poles on ocean surface currents. Because of the arrangement of the continents, warm water is carried far into the North Atlantic, moderating the climate in Northern Europe. As the warm surface water reaches the cold air in the north, it cools. The salty Atlantic water becomes very dense as it gets cold. The cold, salty water sinks to the bottom of the ocean before it can freeze, where it is pulled southward toward the equator. More warm water from the equator flows north to replace the sinking water, setting up a global oceanic “conveyor belt.”
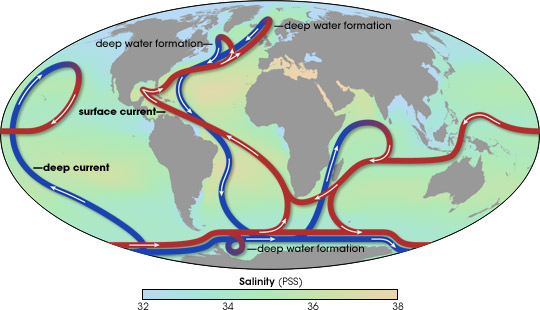
This pattern helps keep Northern Europe far warmer than other locations at the same latitude. The key to keeping the belt moving is the saltiness of the water, which increases the water’s density and causes it to sink. Many scientists believe that if too much fresh water enters the ocean, for example, from melting Arctic glaciers and sea ice, the water will be diluted. Fresh water freezes at a higher temperature than salty water, so the cooling surface water would freeze before it could become dense enough to sink toward the bottom. If the water in the north does not sink, the water at the equator will not move north to replace it. The currents would eventually stop moving warm water northward, leaving Northern Europe cold and dry within a single decade.
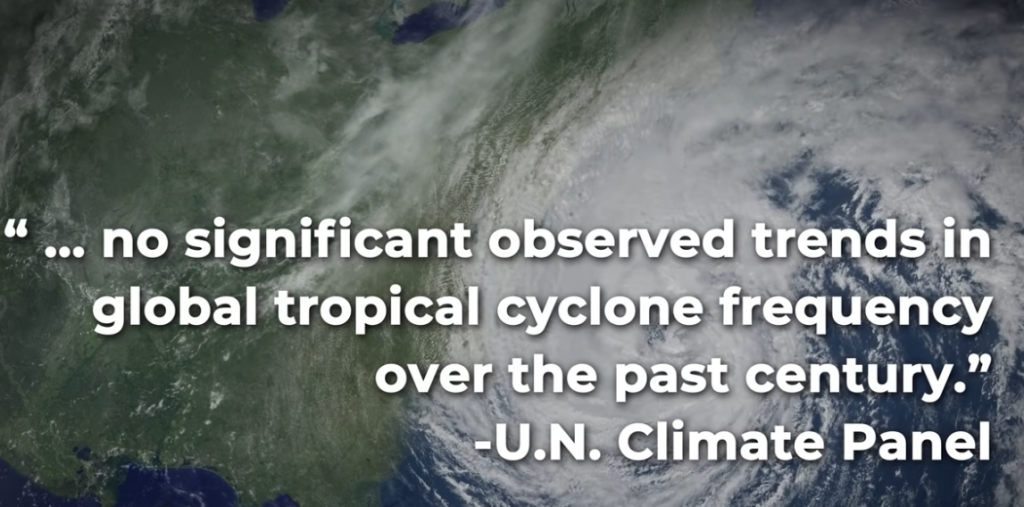
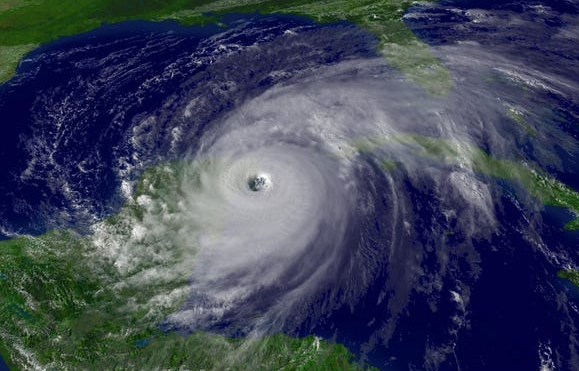
NO data shows weather is getting worse, not even hurricanes as often touted. UN Climate Panel
This theory of rapid climate change is called the “conveyor belt theory,” and though many scientists do not yet agree with it, the paleoclimate record found in ocean sediment cores is beginning to support it. Recent paleoclimate studies have shown that when heat circulation in the North Atlantic Ocean slowed in the past, the climate changed in Northern Europe. Although the last ice age peaked about 20,000 years ago, the warming trend was interrupted at various points by cold spells. In a paper published in Nature on April 22, 2004, McManus and colleagues Roger Francois, Jeanne Gherardi, Lloyd Keigwin and Susan Brown-Leger at Woods Hole Oceanographic Institute and the Laboratoire des Sciences du Climat et de l’environnement in France showed that cold periods in Europe 17,500 and 12,700 years ago happened just after melting ice diluted the salty North Atlantic water, and the ocean “conveyor belt” slowed. The evidence, which they took from radioactive elements in ocean cores, is beginning to support the theory, but McManus cautions that there are still pieces to fill in before we fully understand what role the conveyor belt played in past climate change and what role it might play in the future.
SOURCE: NASA – https://earthobservatory.nasa.gov/features/Paleoclimatology_Evidence/paleoclimatology_evidence_2.php
The CLIMATE EMERGENCY will the most profitable fear campaign in history if we do not stop them.
“The truth does not mind being questioned.
A lie does not like being challenged”
John Coleman Scientist and FOUNDER of the Weather Channel talks about climate change.
John Stossel has been covering the misinformation for many years. They are well informed and entertaining videos. Worth a watch.
The same censors of covid are the same ones suppressing climate change science and data.

Recent Comments